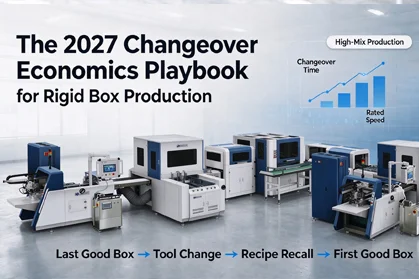
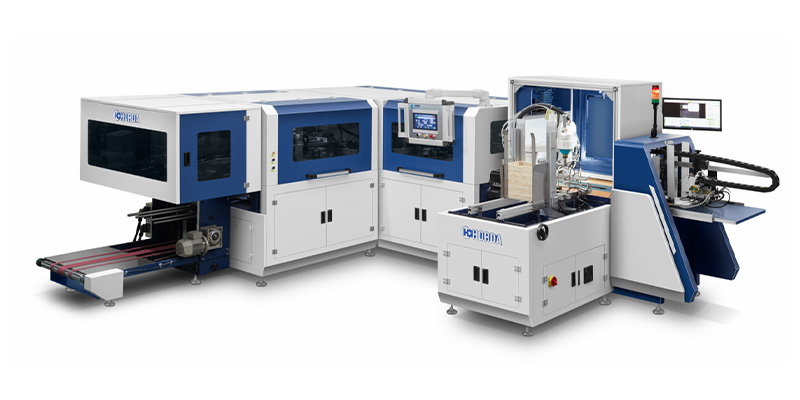
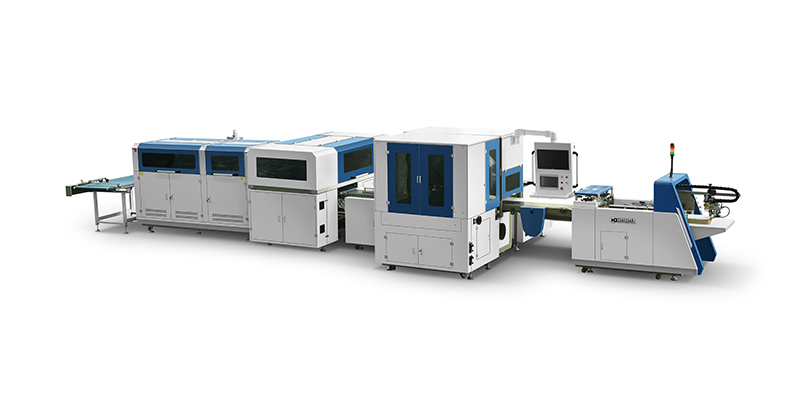
In high-mix rigid box production, changeover time is a more reliable predictor of cost per saleable box than rated speed. Once average batch size falls below roughly 3,000 units and monthly SKU count rises, every 30 minutes removed from a format change typically absorbs more fixed cost per box than a 20% increase in rated speed.
This playbook provides a batch × changeover sensitivity model, a six-step SMED mapping for case making, and first-party changeover log data from a DFM-1000B run. It is written for production and operations managers who need to decide whether to invest in faster running or faster switching.
Rated speed tells you what a line can do when it runs the same format indefinitely. It does not tell you what a line actually delivers when the format changes three times before lunch.
The gap between the two is not a minor correction. It sits inside OEE as availability loss: the line is technically capable of producing, but it is not producing saleable output because it is between jobs. A machine rated at 30 boxes per minute and a machine rated at 24 boxes per minute can end the same shift with identical saleable output if the faster machine spends 90 minutes in changeover and the slower one spends 15.
The practical question, then, is not “which line is faster” but “at what batch size and order mix does changeover time overtake rated speed as the dominant cost variable.” Two dimensions matter most: average batch size and monthly SKU count. When average batch size is above roughly 10,000 units, and SKU count is low, rated speed dominates and changeover is a rounding error. When average batch size falls into the 500–3,000 range, and SKU count climbs, the arithmetic reverses. This is the zone where small-batch production has become the fastest-growing segment of rigid box demand, with customized orders growing at nearly twice the rate of mass production.
If your operation is moving in that direction, the next section gives you the cost model. For a comparison of how automation level interacts with order profile, the comparison of fully automatic and semi-automatic cover forming approaches provides useful context on where flexibility sits in the equipment hierarchy.
Changeover cost is not a single number. It is the sum of four measurable variables, each of which can be observed and recorded on the floor.
Variable 1: Downtime minutes. The interval between the last conforming box of the previous job and the first conforming box of the next. Industry benchmarks place traditional lines at 45–90 minutes per changeover, while lines designed for format flexibility typically land in the 12–18 minute range. SMED-based interventions have been reported to compress changeover to under 30 minutes in packaging operations, with first-article qualification rates above 98%.
Variable 2: Changeover scrap. The boxes that are run during setup and discarded or downgraded. Traditional lines commonly produce 8–20 wasted boxes per changeover; lines with modular tooling and stored recipes typically produce 0–3.
Variable 3: Adjustment labor. The operator-hours consumed by trial runs, glue adjustments, and fine-tuning after the first box emerges. This is often absorbed into “downtime” in informal tracking, but it is a separate cost because it consumes skilled labor that could be deployed elsewhere.
Variable 4: First-article inspection time. The interval required to confirm that the first saleable box meets dimensional and adhesion specifications. This is the variable most often omitted from changeover cost models, yet it determines when the line can be released back to production.
Each of these variables is observable without new capital investment. A clipboard and a stopwatch, applied consistently for two weeks, will produce a baseline that is more useful than any industry average.
The table below translates changeover minutes into fixed-cost absorption per saleable box. It is not a forecast; it is an arithmetic illustration under stated assumptions.
Assumptions: 20 effective production hours per day; rated speed 30 boxes/minute; line hourly cost (depreciation, assigned labor, base energy, maintenance, overhead allocation) set at a representative index value of 1.0; changeover scrap excluded from fixed-cost calculation and treated as material loss separately. Readers should substitute their own hourly cost and speed parameters.
| Batch size (units) | Changeover 90 min (index) | Changeover 60 min (index) | Changeover 30 min (index) | Changeover 15 min (index) | Δ vs. 90 min baseline at 15 min |
|---|---|---|---|---|---|
| 500 | 1.30 | 1.20 | 1.10 | 1.05 | −19% |
| 2,000 | 1.075 | 1.05 | 1.025 | 1.0125 | −5.8% |
| 5,000 | 1.03 | 1.02 | 1.01 | 1.005 | −2.4% |
| 10,000 | 1.015 | 1.01 | 1.005 | 1.0025 | −1.2% |
How to read this table: At a batch size of 500, compressing changeover from 90 minutes to 15 minutes reduces the fixed-cost component per box by approximately 19% in index terms. At 10,000 units, the same compression yields roughly 1.2%. The crossover point—where changeover management stops being the primary cost lever and rated speed regains dominance—sits somewhere between 3,000 and 5,000 units for most rigid box formats, though it shifts with hourly cost and speed.
The implication is not that speed never matters. It is that the value of speed depends on how often the line is allowed to run uninterrupted. If your average batch size is drifting toward the left column, the return on faster switching is likely higher than the return on a higher rated speed.
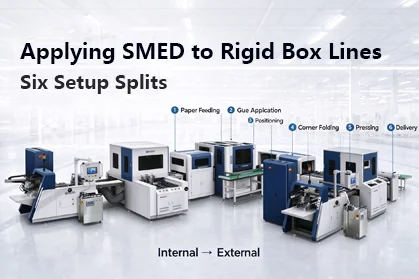
SMED (Single Minute Exchange of Die) is often taught as a manufacturing abstraction. In rigid box production, it becomes concrete at the level of six process steps: paper feeding, glue application, positioning, corner folding, pressing, and delivery.
The core SMED discipline is separating internal activities—those that require the line to be stopped—from external activities that can be prepared while the line is still running. In rigid box lines, the historical obstacle has been that tooling was heavy, bespoke, and mechanically interlocked, which pushed almost every adjustment into the internal category. Modular tooling and digital recipe storage change that boundary.
| Process step | Internal activity (line stopped) | External activity (prepared offline) | Compression lever |
|---|---|---|---|
| Paper feeding | Adjusting feeder angle and vacuum cup positions for new board size | Pre-setting feeder rails on a change cart using locating pins | Cartridge-style feeder modules reduce internal time to under 60 seconds per module |
| Glue application | Purging glue circuit when switching adhesive type or color | Pre-heating replacement glue pot; staging correct adhesive | Quick-purge glue system design shrinks heated adhesive volume between tank and head |
| Positioning | Manually dialing in forming plate and stop positions | Recalling stored servo positions from HMI recipe | Servo axes drive to target positions simultaneously with closed-loop verification |
| Corner folding | Adjusting corner tucker clearances | Pre-aligning tucker cartridges on a subframe | Pre-aligned cartridges eliminate trial-and-error alignment |
| Pressing | Setting pressure dwell and plate height | Pre-selecting recipe parameters on HMI | Electronic recipe recall removes manual gauge-block adjustments |
| Delivery | Re-timing conveyor and stacker for new box height | Pre-staging stacker guides | Recipe-linked conveyor timing |
The practical takeaway is not that every line can adopt every lever at once. It is that each lever shifts a specific internal activity into the external column, and the cumulative effect is what moves a 90-minute changeover toward the 15-minute range. The SMED framework applied to case making is not a theoretical exercise; it is a checklist of where to look for minutes.
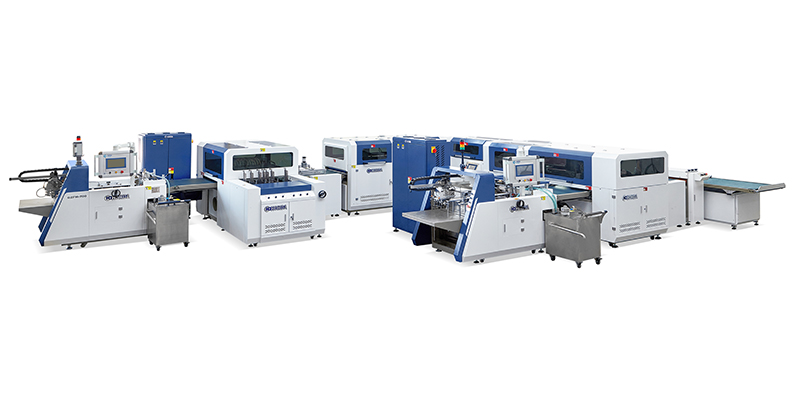
The following log is a first-party record from a DFM-1000B multifunctional case making and lining machine, captured under stated conditions. It is presented not as a universal benchmark but as a transparent process record that readers can compare against their own observations.
Test conditions: Standard greyboard (1.5 mm) with coated paper wrap; Job A: book-style box, 220 × 160 × 45 mm; Job B: telescopic lid box, 180 × 120 × 50 mm; no special tooling change beyond the standard forming cartridge set; ambient temperature and humidity within normal workshop range.
| Sequence | Action | Elapsed (min: sec) | Cumulative |
|---|---|---|---|
| 0 | Last conforming box of Job A | 0:00 | 0:00 |
| 1 | Forming cartridge A removed; cartridge B docked | 1:10 | 1:10 |
| 2 | Glue pattern recalled from recipe; nozzle position verified | 2:05 | 3:15 |
| 3 | Feeder rails repositioned via locating pins | 1:40 | 4:55 |
| 4 | Servo axes driven to Job B recipe; position interlocks confirmed | 1:25 | 6:20 |
| 5 | Trial box run and dimensional check | 2:10 | 8:30 |
| 6 | First conforming Job B box confirmed; line released | 1:35 | 10:05 |
Result: Total changeover time from last conforming Job A box to first conforming Job B box was 10 minutes 5 seconds. Changeover scrap was 2 boxes. First-article dimensional check passed on the first trial box.
Limitations: This log does not include changeovers that require special tooling fabrication, adhesive chemistry changes (e.g., hot melt to cold glue), or non-standard box formats with asymmetric closures. Those conditions should be expected to extend changeover time and should be verified through a site-specific trial. The log is intended to illustrate what a modular tooling and recipe-driven architecture makes observable and repeatable, not to claim that every DFM-1000B changeover will match this record.
For readers comparing machine configurations against their own order mix, the available cover linkage line configurations and their tooling interfaces are documented at the product category level.
Tooling standardization is the capital decision that makes short changeovers repeatable. It has a cost, and that cost has a payback period.
The investment side includes standardizing fixture interfaces (locating pins, quick-clamps, common subframes), converting bespoke forming plates into cartridge-style modules, and documenting recipe parameters for every active SKU. The benefit side is the changeover minutes removed multiplied by the number of changeovers per year multiplied by the value of a production minute.
A three-year payback model looks like this:
Annual changeover value = (minutes saved per changeover) × (changeovers per year) × (line cost per minute)
Payback period = (tooling standardization investment) ÷ (annual changeover value − annual maintenance of standardized tooling)
The variables that swing the result most are changeovers per year and line cost per minute. A plant running 15 changeovers per week (approximately 750 per year) with a line cost of USD 1.20 per minute recovers USD 27,000 per year for every 30 minutes removed per changeover. At that rate, a standardization investment in the low-to-mid five figures has a payback under three years before accounting for scrap reduction and first-article yield improvement. A plant running three changeovers per week will see a materially longer payback and should prioritize other levers first.
The tooling standardization question is inseparable from the broader changeover economics of the line. It is not a standalone purchase; it is the infrastructure that makes the sensitivity table’s left-hand column achievable. Readers evaluating tooling interfaces across machine configurations can compare the forming and tooling interfaces across the case making machine line series at the category level.
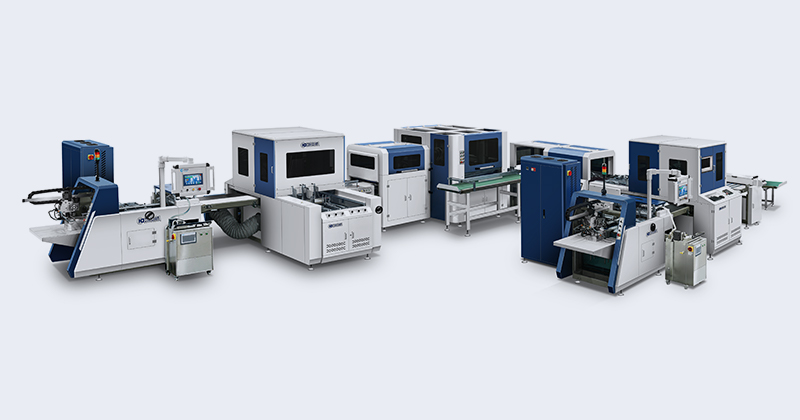
Three threshold rules can help a production team decide where to direct capital and improvement effort. They are stated as decision rules, not universal prescriptions; each should be validated against actual line data.
Rule 1 — The batch-size trigger. If average batch size is consistently below 3,000 units and monthly SKU count exceeds 10, a 30-minute reduction in changeover time is likely to produce a larger per-box cost reduction than a 20% increase in rated speed. If average batch size is above 8,000 and SKU count is low, the reverse is typically true.
Rule 2 — The changeover-frequency trigger. If the line performs more than 10 changeovers per week, the annual value of changeover minutes is high enough that tooling standardization and SMED mapping should be evaluated before any speed upgrade. Below 5 changeovers per week, speed and uptime usually dominate the cost equation.
Rule 3 — The first-article yield trigger. If first-article rejection or rework after changeover exceeds 5% of the batch, the problem is likely tooling repeatability or recipe documentation rather than operator skill. In that case, the first intervention should be standardizing setup parameters and recording them, not buying a faster machine.
These rules are deliberately coarse. Their purpose is to help a team avoid the most common misallocation: investing in speed when the actual constraint is switching.
For lines with modular tooling and stored recipes, 15–20 minutes is a reasonable operating target across common box formats. Traditional lines without these features commonly run 45–90 minutes. The gap is a function of architecture and tooling, not operator effort alone.
Less than on a saturated line. On a line with spare capacity, a lost changeover minute costs the resources consumed but not necessarily a lost sale. On a bottleneck line, the same minute is lost revenue. The sensitivity table assumes a constrained line; if your line has idle capacity, the financial case for changeover investment is weaker and should be sized accordingly.
Traditional lines commonly produce 8–20 wasted boxes per changeover; flexible lines with recipe-driven setup typically report 0–3. Scrap at changeover should be tracked separately from running scrap, because the two have different causes and different fixes.
Partially. Externalizing setup preparation—pre-staging tooling, documenting recipe parameters, organizing change carts—can reduce internal time on existing equipment. The larger gains from cartridge tooling and servo recipe recall require equipment architecture that supports them. A practical first step is to record two weeks of changeovers and classify each activity as internal or external; that baseline will show where the low-cost gains sit.
No. The payback depends on changeover frequency, batch size, and line cost per minute. A plant with infrequent changeovers and large batches may find that uptime and speed improvements deliver a shorter payback. The three decision rules above are intended to help frame that comparison before capital is committed.
In this article they are used interchangeably to mean the interval between the last conforming unit of the previous job and the first conforming unit of the next. Some operations track “setup time” as the mechanical adjustment only, excluding first-article inspection and trial runs. For cost purposes, the broader definition is more useful because it captures the full period during which the line is not producing saleable output.
The most important judgment is not whether faster changeover is “better” in the abstract. It is whether your order profile places you in the zone where changeover minutes dominate cost per box. If average batch size is falling and SKU count is rising, the arithmetic in the sensitivity table is likely to be more decision-relevant than a rated-speed comparison.
The error to avoid is treating changeover as an operator performance issue rather than an architecture and tooling issue. When first-article yield is inconsistent and setup time is long, the first place to look is whether tooling is standardized and whether recipes are stored, not whether the operator is working fast enough.
Technical confirmation is needed before any capital commitment: changeover time varies with box format, tooling condition, adhesive type, and material. A two-week baseline measurement on your own line is the appropriate starting point, followed by a structured comparison of tooling and recipe capabilities across the configurations under consideration.
To review the configurations that support the changeover performance discussed in this article, explore the available cover linkage line configurations and their tooling interfaces or contact us to discuss your requirements.

 English
 Español
 Português