A factory running 50 jobs a month at an average batch of 800 boxes is not a smaller version of a factory running 5 jobs a month at 8,000 boxes. It is a different kind of factory, and it needs a different production logic. The useful question before comparing machines is not “how fast” or “how flexible” in the abstract, but where your order mix sits on two dimensions: monthly job count and average batch size.
This article provides a two-dimensional profile, shows which configurations hold up in each zone, and maps each profile to the configuration dimensions worth prioritizing next.
Most production planning conversations start with the machine. Ours usually start with the order book, because the order book decides which machine characteristics actually matter.
Two factories can run the same box format on the same board caliper and still need different production logic. One receives five orders a month, each running for several days. The other receives fifty orders a month, each running for a few hours. The first factory’s constraint is throughput per run; the second factory’s constraint is time between runs. A configuration that solves the first factory’s problem can make the second factory’s problem worse, and vice versa.
This is why we ask for the order mix before we discuss configuration. The mix is not a detail to be refined later; it is the input that determines which configuration dimensions are worth optimizing. The two dimensions that matter most are monthly job count and average batch size. Together they define what we call the order mix profile.
Monthly job count measures how often the line has to change over. A factory with 50 jobs a month is changing over roughly 2–3 times per working day; a factory with 5 jobs a month is changing over roughly once every few days. The frequency determines how much of the month is spent in setup versus in running.
Average batch size measures how long each run lasts. A batch of 800 boxes at a rated speed of 30 boxes per minute is under 30 minutes of pure running time; a batch of 8,000 is closer to 4.5 hours. The batch size determines whether the setup time is a small fraction of the run or a large one.
Neither dimension is sufficient alone. A factory with 50 jobs a month but batches of 8,000 is a different case from a factory with 50 jobs a month and batches of 500. The first has frequent changeovers but long runs between them; the second has frequent changeovers and short runs, which is the harder case. The two dimensions have to be read together.
The table below is a starting point for reading the combination. It is not a scoring system; it is a way to locate a factory on the map before deciding what to optimize.
| Monthly job count | Average batch size | Order mix profile | What the line is actually constrained by |
|---|---|---|---|
| Low (≤ 10) | High (≥ 5,000) | Speed-led | Throughput per run; setup time is a small fraction of the month |
| Low (≤ 10) | Low (≤ 1,000) | Mixed, batch-sensitive | Short runs with infrequent changeovers; batch size matters more than changeover frequency |
| High (≥ 30) | High (≥ 5,000) | Mixed, changeover-sensitive | Frequent changeovers but long runs; changeover time matters more than batch size |
| High (≥ 30) | Low (≤ 1,000) | Flexibility-led | Both changeover time and batch size press on the line; setup efficiency dominates |
Reading the table: the two “mixed” profiles are the most common in practice, and they are also the most often misdiagnosed. A factory with high job count and high batch size often assumes it needs a faster machine, when what it actually needs is faster changeover. A factory with low job count and low batch size often assumes it needs a more flexible machine, when what it actually needs is better batch planning. The profile is a starting point, not a verdict.
The flexibility-led zone—high job count, low average batch—is the profile where configuration choices have the largest effect on cost per box. This is also the zone where the most common configuration mistake occurs: buying for rated speed when the line will spend most of its time in changeover.
In this zone, three configuration dimensions matter more than rated speed:
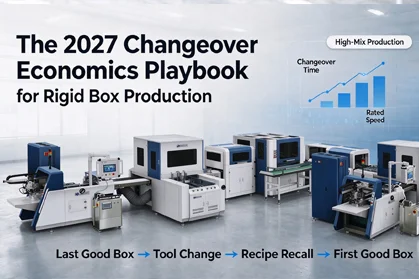
Changeover architecture. Modular tooling, cartridge-style forming plates, and recipe-driven servo positioning are the levers that move setup work offline. A line without these features will spend a large share of each shift in setup regardless of how fast it runs when it is running. The changeover economics framework provides the cost model for sizing this investment against batch size.
Recipe repeatability. First-article yield after changeover is the variable that determines whether the line is released back to production quickly or held for adjustment. A line that passes first-article on the first attempt most of the time behaves very differently from a line that requires trial runs, even if both have the same nominal changeover time.
Batch planning discipline. In the flexibility-led zone, the production plan is part of the configuration. Grouping jobs by board caliper and adhesive type, sequencing jobs to minimize adhesive changes, and pre-staging tooling for the next two jobs are planning actions that reduce effective changeover time without any hardware change. A factory that plans batches well can run a less flexible line than a factory that does not.
What does not hold up well in this zone is a configuration optimized purely for rated speed with minimal tooling modularity. The line will run fast when it runs, but it will not run often enough for the speed to translate into output.
The speed-led zone—low job count, high average batch—is the profile where rated speed and uptime dominate. In this zone, the line runs for long stretches between changeovers, and the cost of a changeover is amortized over a large batch. The configuration priorities invert.
Three dimensions matter most here:
Rated speed and running stability. When the line runs for hours at a time, the difference between 25 and 35 boxes per minute compounds across the batch. Running stability—how consistently the line holds speed without micro-stops—matters as much as the rated number.
Uptime and maintenance access. In a long-run environment, an unplanned stop costs more than a planned changeover, because there is no batch amortization to absorb it. Maintenance access, spare parts availability, and remote diagnostic capability become configuration criteria rather than afterthoughts.
Consumable efficiency. Glue consumption, board waste at the head and tail of a run, and energy per box all scale with running hours. A line that runs 20 hours a day has a different consumable cost profile from a line that runs 6 hours a day, and the difference is large enough to affect the configuration decision.
What does not hold up well in this zone is over-investing in changeover modularity at the expense of running stability. A highly modular line that micro-stops under continuous load will underperform a simpler line that runs steadily, even if the modular line changes over faster.
Most factories we work with do not sit cleanly in either extreme. They sit in one of the two mixed zones, and the mixed zones are where the diagnostic question matters most.
High job count + high batch size (changeover-sensitive). This factory changes over often, but each run is long enough that the changeover is not the dominant cost. The common misdiagnosis is to buy a faster machine, because the factory feels “busy.” The more useful question is whether the changeover frequency is being driven by genuine order mix or by planning fragmentation—running the same board caliper and adhesive across multiple small jobs that could be consolidated. If the frequency is genuine, changeover investment pays; if it is planning-driven, batch consolidation pays more.
Low job count + low batch size (batch-sensitive). This factory changes over infrequently, but each run is short. The common misdiagnosis is to buy a more flexible machine, because the batches feel “small.” The more useful question is whether the short batches are a market reality or a symptom of order acceptance policy—taking many small orders that could be quoted at a higher minimum. If the short batches are genuine, flexibility investment pays; if they are policy-driven, the first lever is commercial, not technical.
The two mixed zones are where the order mix profile earns its keep. They are also where the conversation most often jumps to machine selection before the diagnosis is complete.
Once a factory has located itself on the profile, the next question is which configuration dimension to prioritize. The table below maps each profile to the dimensions worth examining first. It is a prioritization aid, not a specification.
| Order mix profile | First dimension to examine | Second dimension | What to defer |
|---|---|---|---|
| Flexibility-led (high jobs, low batch) | Changeover architecture (tooling modularity, recipe recall) | Batch planning discipline | Rated speed premium |
| Changeover-sensitive (high jobs, high batch) | Whether changeover frequency is genuine or planning-driven | Changeover architecture, if genuine | Flexibility premium beyond what the order mix requires |
| Batch-sensitive (low jobs, low batch) | Whether batch size is market reality or order policy | Flexibility, if genuine | Speed premium |
| Speed-led (low jobs, high batch) | Rated speed and running stability | Uptime and consumable efficiency | Changeover modularity beyond a baseline |
The mapping is deliberately coarse. Its purpose is to prevent the most common misallocation: investing in the dimension that feels urgent rather than the dimension the order mix actually constrains.
Use the peak-season profile for configuration decisions and the off-season profile for planning decisions. A factory that runs 80 jobs a month in Q4 and 20 in Q1 should configure for the Q4 profile, because the peak is when the constraint binds. The off-season is where batch consolidation and maintenance scheduling can be prioritized.
It depends on the batch size and the working calendar. Fifty jobs a month on a single shift is roughly 2–3 changeovers per working day, which is high for a rigid box line without modular tooling. Fifty jobs a month across three shifts is closer to one changeover per shift, which is more manageable. The number has to be read against the calendar, not in isolation.
Yes, but the two characteristics trade off in the configuration. A line can be designed for both, but the cost of the combination is higher than the cost of either alone. The question is whether the order mix justifies paying for both. A factory with 50 jobs a month and 8,000-unit batches may justify it; a factory with 5 jobs a month and 500-unit batches probably does not.
It changes the cost of each profile, not the profile itself. A fully automatic line in the flexibility-led zone still needs changeover architecture and recipe repeatability; the automation affects labor cost and consistency, not the underlying order mix constraint.
At least annually, and whenever the sales mix shifts materially. A factory that moves from 20 jobs a month to 40 has changed profile, and the configuration priorities that were correct at 20 may be wrong at 40. The profile is a snapshot of the order book, not a permanent classification.
This is common in factories that serve both a high-volume segment and a custom segment. The two lines should be configured differently, and the planning discipline should keep the profiles from bleeding into each other—running a high-volume job on the flexible line because the flexible line is idle is a common way to lose the flexibility advantage.
The most important judgment before comparing machines is not which machine is faster or more flexible. It is where your order mix sits on the two-dimensional profile, and whether the constraint you feel is the constraint the profile actually identifies. A factory that misreads its profile will buy the wrong configuration and then blame the machine.
The error to avoid is treating “speed” and “flexibility” as a binary choice. Most factories sit in one of the two mixed zones, where the first question is diagnostic—whether the job count or batch size is genuine or planning-driven—before it becomes technical. Getting that diagnosis right is worth more than any single configuration upgrade.
Technical confirmation is needed before committing to a configuration direction: the profile thresholds shift with box format, board caliper, adhesive type, and working calendar. A two-week record of actual job count and batch size is the appropriate starting point, followed by a comparison of configuration dimensions against the profile the record reveals.
To see how changeover minutes translate into cost per saleable box once the profile is known, the changeover economics playbook provides the financial model. To review the equipment configurations that support each profile direction, review the available cover making machine configurations, or compare the forming and tooling interfaces across the case making machine series.

 English
 Español
 Português